Data gallery

Browse graphs of phenology data to choose your own adventure.

Icon showing a graph with datapoints and a trendline

The graphs on this page were created using historical data donated by observers from several places in Minnesota. Those observers all kept careful records of when they noticed key changes in their environment. Presenting their records in the form of graphs is helpful for seeing overall patterns and detecting change over time.

With over 130 graphs similar to the ones below, the Season Watch website is a jumping off point for getting curious about Minnesota's cycles, climate, and future.


Explained graphs

The graphs below are accompanied with explanations recorded by Season Watch team members.

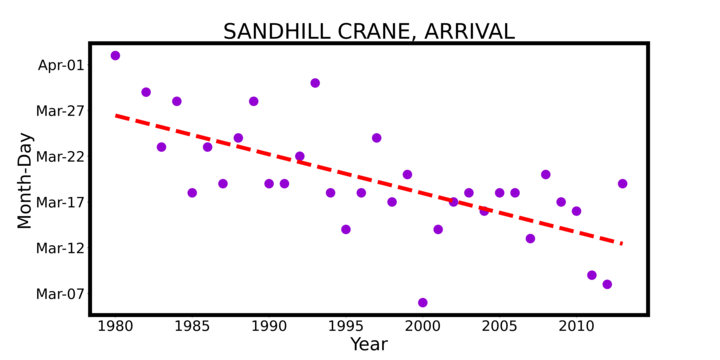
Scatterplot showing sandhill crane phenology observations in Sherburne County, Minnesota
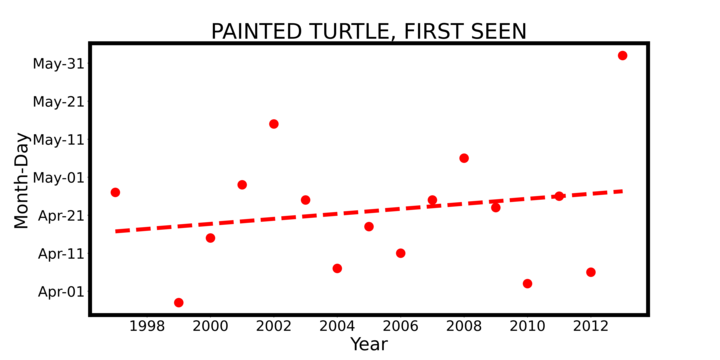
Scatterplot showing painted turtle phenology observations in Carlton County, Minnesota
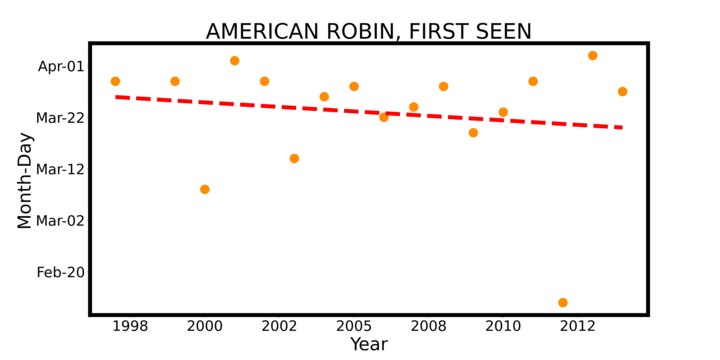
Scatterplot graph showing dates when American robins were first seen in Hubbard County, Minnesota.
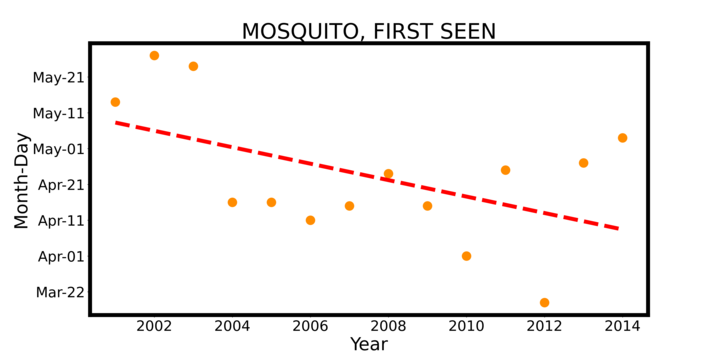
Scatterplot graph showing dates when mosquitoes were first seen in Hubbard County, Minnesota
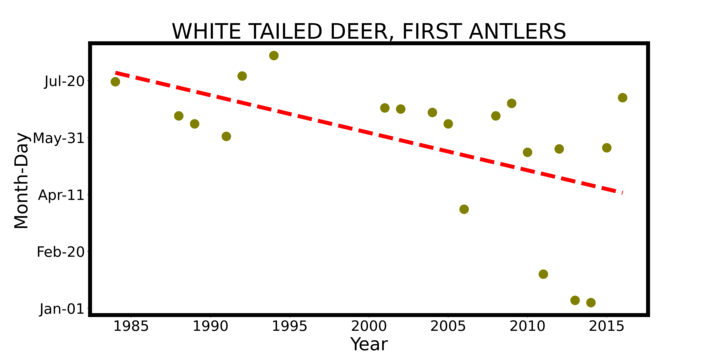
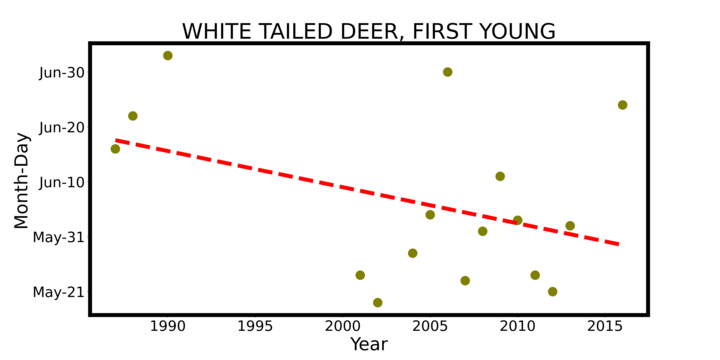
Scatterplot showing observations of white-tailed deer phenology in Itasca County, Minnesota. Most of the observations occurred in June, more or less.

Below are several more graphs, organized into themes: Animals emergingMigratorsAnimal reproductionFruits, and Fall color.

For additional guidance on how to read scatterplots and summary statistics, see the Season Watch Orientation Center.
 

Animals emerging

These scatterplots show when four different animals are first seen in spring after being inactive during winter.

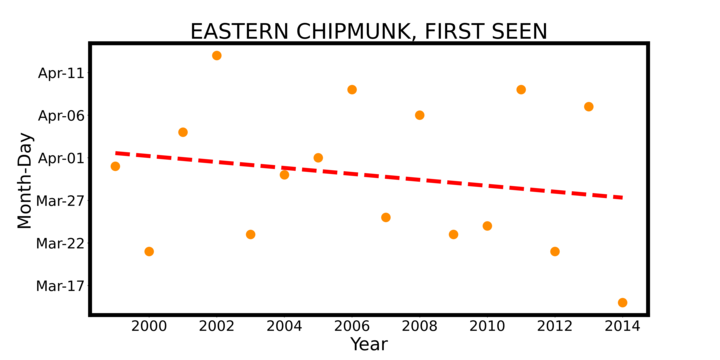
Scatterplot showing eastern chipmunk phenology observations in Hubbard County, Minnesota
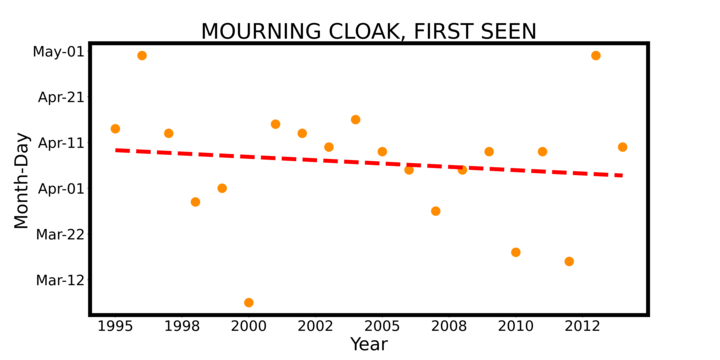
Scatterplot showing mourning cloak phenology observations in Hubbard County, Minnesota
Scatterplot showing painted turtle phenology observations in Carlton County, Minnesota
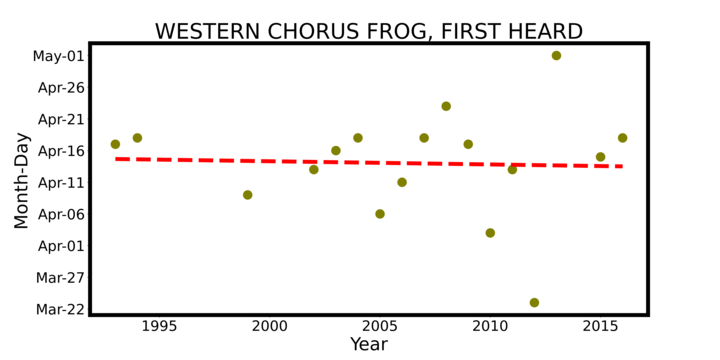
Scatterplot showing western chorus frog phenology observations in Itasca County, Minnesota


Migrators

These scatterplots show the timing of migration for four different animals.

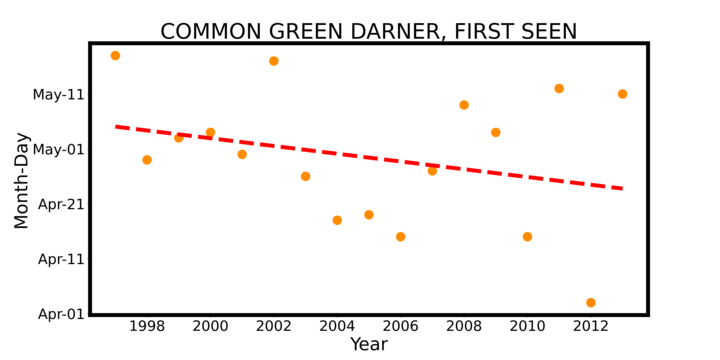
Scatterplot showing common green darner phenology observations in Hubbard County, Minnesota
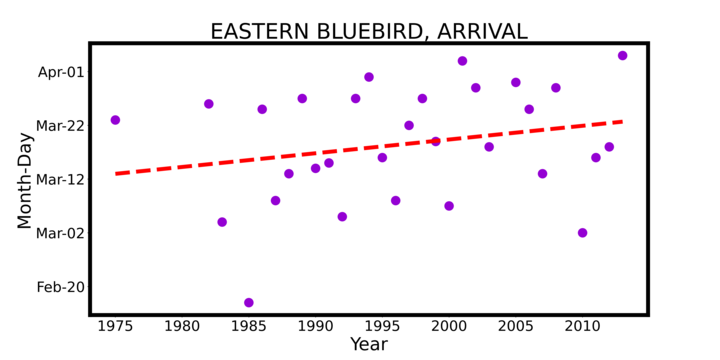
Scatterplot showing eastern bluebird phenology observations in Sherburne County, Minnesota
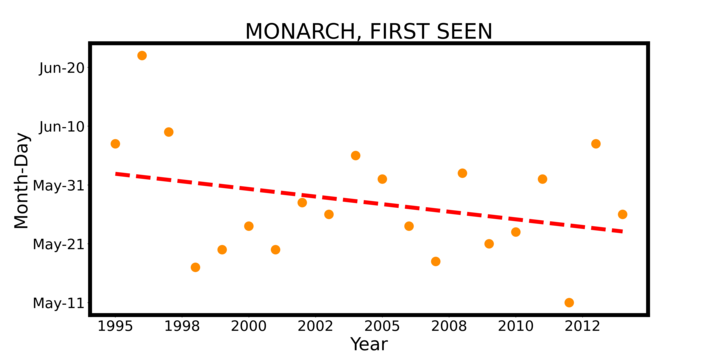
Scatterplot showing monarch phenology observations in Hubbard County, Minnesota
Scatterplot showing sandhill crane phenology observations in Sherburne County, Minnesota


Animal reproduction

These scatterplots show the timing of reproduction, based on a variety of observable clues.

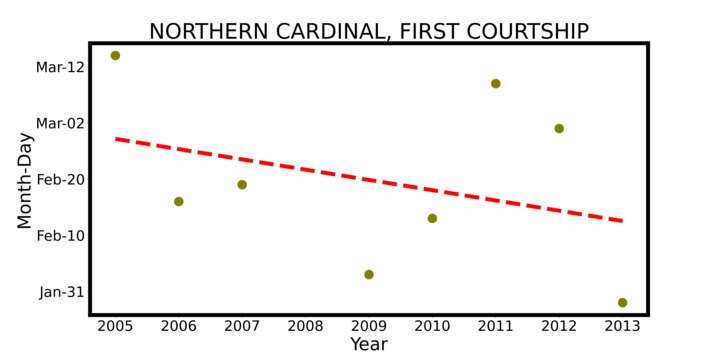
Scatterplot showing northern cardinal phenology observations in Itasca County, Minnesota
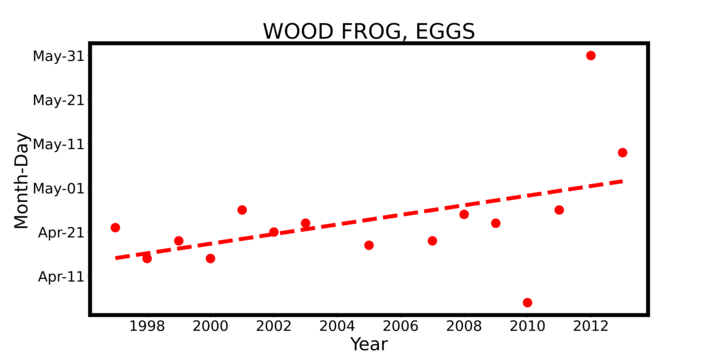
Scatterplot showing wood frog phenology observations in Carlton County, Minnesota
Scatterplot showing white-tailed deer phenology observations in Itasca County, Minnesota
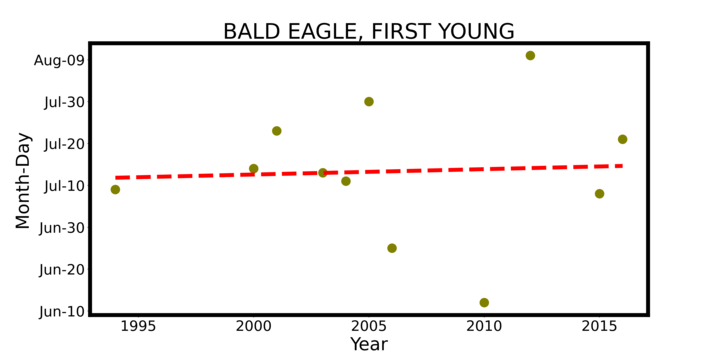
Scatterplot showing bald eagle phenology observations in Itasca County, Minnesota


Fruits

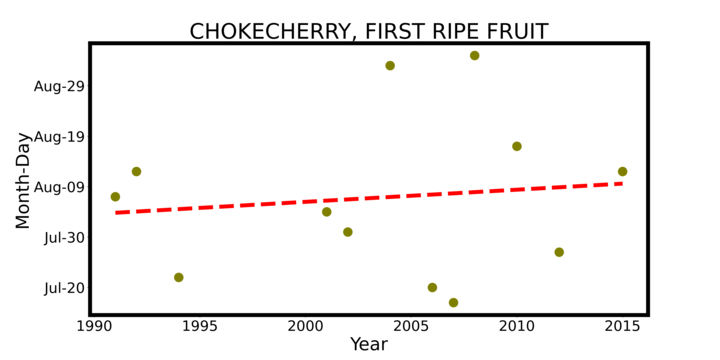
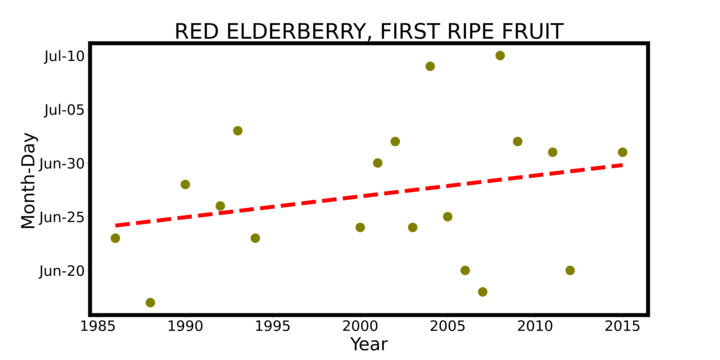
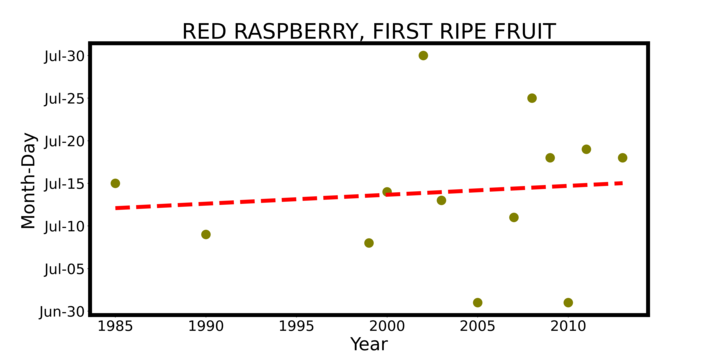
These scatterplots show the timing of fruits for a sampling of Minnesota plants.

Scatterplot showing chokecherry phenology observations in Itasca County, Minnesota
Scatterplot showing red elderberry phenology observations in Itasca County, Minnesota
Scatterplot showing American red raspberry phenology observations in Itasca County


Fall color

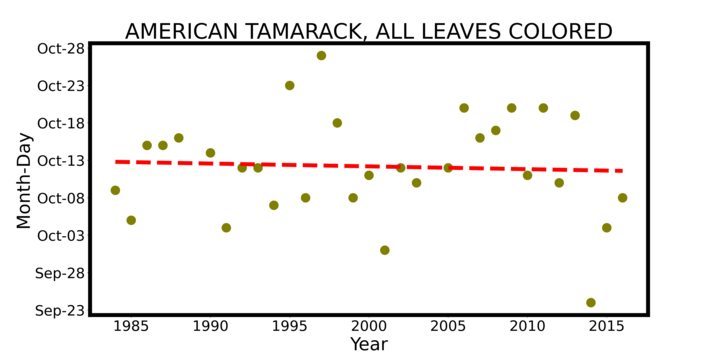
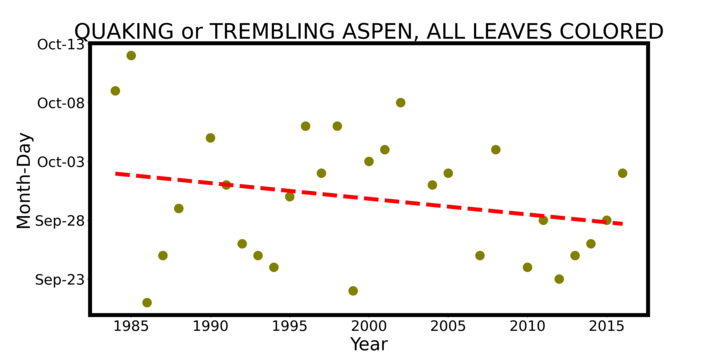
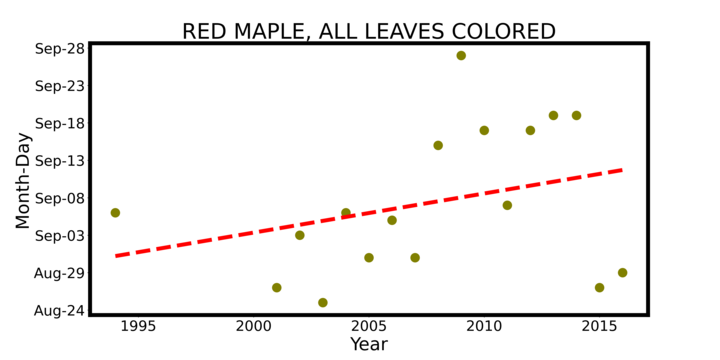
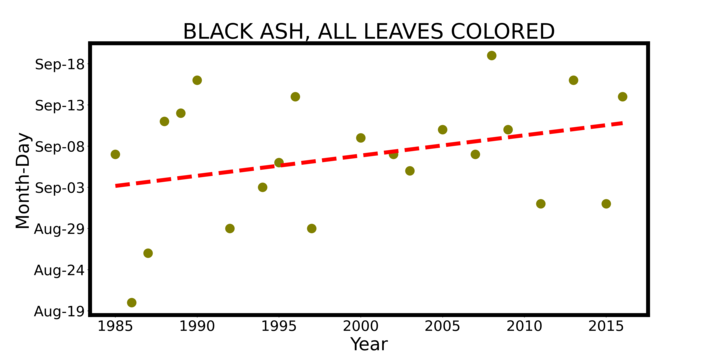
These scatterplots show when autumn color occurs for four different tree species.

Scatterplot showing American tamerack phenology observations in Itasca County, Minnesota
Scatterplot showing quaking aspen phenology observations in Itasca County, Minnesota
Scatterplot showing red maple phenology observations in Itasca County, Minnesota
Scatterplot showing black ash phenology observations in Itasca County, Minnesota