Welcome!
Season Watch is an educational website focused on Minnesota phenology.
The Season Watch website invites you to browse profiles of plants and animals, learn about clues to look for, view data from the past, and get curious about the future of Minnesota environments.
This page explains some of the terms, ideas, and kinds of information you'll find on the Season Watch website.
What is phenology?
Phenology is the study of seasonal changes in plants and animals, and how those changes relate to climate.
Even if the word is new to you, the concept is familiar. When you notice certain seasonal changes—such as the first dandelion in spring or a flock of geese flying south in fall—you are noticing phenology.
Using phenology as a lens, the Season Watch website reveals deeper stories behind everyday observations of Minnesota plants and animals. The stories focus on how plants and animals undergo changes as part of their annual cycles. These changes are called phenophases.
Disambiguation: What phenology is not.
Sometimes people confuse the term "phenology" with other unrelated words, especially "phonology" and "phrenology".
Phonology is a branch of linguistics that studies sounds of human speech and organizes them into systems.
Phrenology is a disreputable pseudoscience that purported to characterize people's personalities based on the shape of their heads.
Video: Introduction to Minnesota phenology
Phenology is explained and illustrated in this video by Minnesota Phenology Network.
What is a phenophase?
A phenophase is an observable part of a plant or animal's life cycle. Phenophases always have a beginning and an end. Often (but not always), phenophases are fleeting and linked to certain times of year.
Video: Exploring Phenophases
Phenophases are explained and illustrated in this video by Minnesota Phenology Network.
Here are some examples of phenophases:
- The flowering of red maple trees
- The change of tamarack needles from green to yellow
- The arrival of dark-eyed juncos in the fall
- A northern cardinal singing
- A spring peeper frog calling
For practice using the phenophase concept, see "Stories of Noticing". For guidance on collecting phenophase data in a standardized way, see Nature’s Notebook. The USA-National Phenology Network publishes a glossary, helpful as a reference for phenologists with any level of experience.
When you fully describe the status of a plant or animal in a way that can be tracked from year to year, you are making a phenology record.
What is a phenology record?
A phenology record is a piece of information written down by a phenology observer. To make a record, the observer describes not only what happens in nature, but also when and where things happen. All phenology records have four essential parts:
- Identify the plant or animal. Whenever possible, identify to the level of species. Example: Learn what makes a red maple distinct from other types or species of maple trees. When observing a red maple, write down "red maple" rather than broader terms such as "maple tree" or "deciduous tree". One reason this is important is that it improves the usefulness of records. For example, a researcher wanting to study the phenology of red maples may need to exclude records on "maple trees" because they are not specific enough. If you cannot confidently identify the species, simply use the most specific descriptor or group you can. For example, "mosquito" and "bumblebee" are groups with many species, but telling them apart takes specialized knowledge that most people do not have.
- Describe the status of the plant or animal. When writing down this part of your record, ask yourself, "What is the plant or animal doing?" This part of your phenology record might be simple, such as "Adult American toads are present" or "Adult American toads are absent". Or, your status note could be detailed. For example, "Adult American toads (three individuals) are present and vocalizing," or even, "Calls of individual American toads can be distinguished but there is some overlapping of calls.". The latter provides information about the intensity of toad vocalizations and uses Nature's Notebook's guidance to describe phenophase intensity in a standardized way.
- Write down the date of your observation, including the year. Notes on conditions (e.g., sunny or rainy) are helpful, but usually, that kind of information can be derived from other data sources, so long as the observation date is recorded.
- Write down where you made the observation. The more specific you are, the better. For example, if you write down the name of a park where you go to observe, be sure to also write down the city and state because there could be many parks with the same name. You could write down and address, or even geographic coordinates (latitude and longitude), if you know them. Sometimes records are kept at the county level to protect the whereabouts of the observer or the species being observed.
When records have all four parts, they can be compared, contrasted, and brought together to understand greater patterns. A collection of phenology records is called a phenology dataset.
What is a phenology dataset?
A phenology dataset is a collection of phenology records. People make datasets to get a big-picture understanding of complex processes. To illustrate what phenology datasets are, how people make them, and why they are valuable, here are a few examples:
- John wondered when sandhill cranes migrate into his part of the state. In 1980, after not seeing or hearing cranes in January, Feburary, and March, he suddenly heard them on April 2. He recorded his observation by writing down the species (sandhill crane), its status (present, vocalizing), the date, and the location (Sherburne County). He repeated this process every year through 2020. Now he has a dataset, a collection of records. The dataset has value because it is a way to understand when sandhill cranes arrive in Sherburne County and if that timing has shifted or stayed the same from 1980 to 2020.
- Lolita joins a collaborative science projected called Green Wave. She participates by making weekly observations on three individual trees that grow on the block where she lives. Every time she observes those trees, she records their status, one by one. Does this tree have leaves? (Yes or no.) Does this tree have flowers? (Yes or no.) Does this tree have fruits? (Yes or no.) After three years, Lolita has an impressive dataset about tree phenophases in her location. Moreover, the team of Green Wave scientists can combine Lolita's dataset with data from other observers to see patterns and make comparisons.
- Sam wonders when their favorite snowbird, the dark-eyed junco, is likely to show up in the neighborhood. But Sam doesn't have their own records from past years. Instead, Sam explores records made by other people on eBird. Using eBird's Bar Chart tool, Sam finds a historical dataset (1900 to present-day) on the week-by-week occurrence of dark-eyed juncos in Crow Wing County. Sam used eBird to narrow their inquiry to records related to juncos from the county where they live. Sam uses the dataset to learn big-picture information: juncos are likely to start showing up by mid-September.
Datasets contain a lot of detailed information. How can one easily see the most important facts in a dataset without getting lost in all the details? One way is to use summary statistics such as average, minimum, and maximum. Another way is to use graphs, which are simple pictures made from data.
How do I read graphs on the Season Watch website?
Video: How to read a scatterplot graph
Text: How to read a scatterplot graph
Graphs are simple pictures made with data. They present the data in a visual way and are especially useful for understanding overall patterns and relationships. The kind of graphs presented on the Season Watch website are scatterplots.
Each part of a scatterplot communicates a different piece of information. If you are new to scatterplots, practice identifying the parts listed below and fitting them together to read the meaning of a graph.
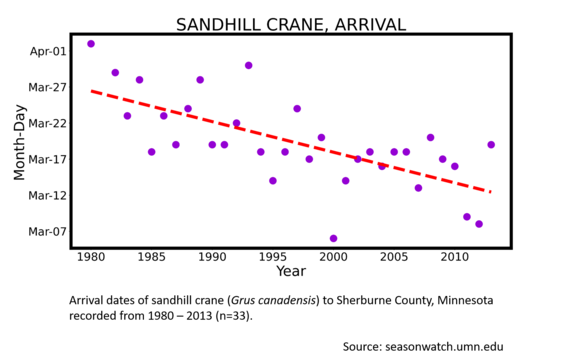
The title is located at the top and tells you what is being described by the data. Graphs on the Season Watch website always tell you the species (or group of species) and the stage of life (or phenophase) that was observed.
Located underneath the graph, the caption uses broad terms to explain what is being shown. Season Watch captions include the county where observations were made, as well as the sample size (that is, the number of observations in a dataset).
Located along the bottom of a graph, the x-axis contains information about when observations were made. On this website, the x-axis always shows a sequence of years that you can read from left to right.
Located along the left edge of a graph, the y-axis contains information about when observations were made. On this website, the y-axis always shows times of the year that you can read from bottom to top.
Both the x- and y-axes contain information about time, but they use different units. The x-axis uses a full year as its unit, whereas the y-axis uses days or weeks as its unit.
Each dot in the graph represents a single observation. To interpret any dot, or data point, examine its position along the x-axis and the y-axis. These positions indicate the year and the time of year when an observation was made. For example, this observation of sandhill crane arrival happened in the year 2000, on March 4th.
The trendline is the red dotted line that crosses the graph space. It is useful to understand overall patterns and relationships. For graphs on the Season Watch website, trendlines help one detect change over time. That is, over a span of years, is a phenophase shifting to occur earlier in the year, later, or is there no change? One can also get a sense of how much variation, or scattering, there is around the line. The trendline is sometimes called a "fitted regression line."
See the Data Gallery page for more examples of how to read scatterplot graphs.
Season Watch presents summary statistics. But what does that mean?
Video: What are summary statistics?
Text: What are summary statistics?
Summary statistics report important features of a dataset. As the word "summary" suggests, summary statistics cannot describe every detail of a dataset, but rather they pull forward key, overall information.

- Average: March 18
- Latest: March 31
- Earliest: March 4
An average is a way of understanding what value is typical in a dataset. An average can help people make reasonable guesses of what to expect. For example, for this dataset, the average date of sandhill crane arrival to Sherburne County is March 18. One infers that March 18th is a reasonable time to expect the return of sandhill cranes in that area.
A maximum is the greatest value within a dataset. It helps people set upper boundaries on what to expect. Because timing is the focus of Season Watch, the maximum is the latest date among all records in a dataset. For example, for this dataset, the latest sandhill crane arrival to Sherburne County is March 31. One can infer that an April arrival would be unusually late.
A minimum is the smallest value within a dataset. It helps people set lower boundaries on what to expect. Because timing is the focus of Season Watch, the minimum is the earliest date among all records in a dataset. For example, for this dataset, the earliest sandhill crane arrival to Sherburne County is March 4. One can infer that a February arrival would be unusually early.
Keep in mind that summary statistics are calculated from real, historical datasets. Because of this, they reflect the conditions that were occurring as the data were collected. This means that context—place and time—is important whenever thinking about the meaning of summary statistics.
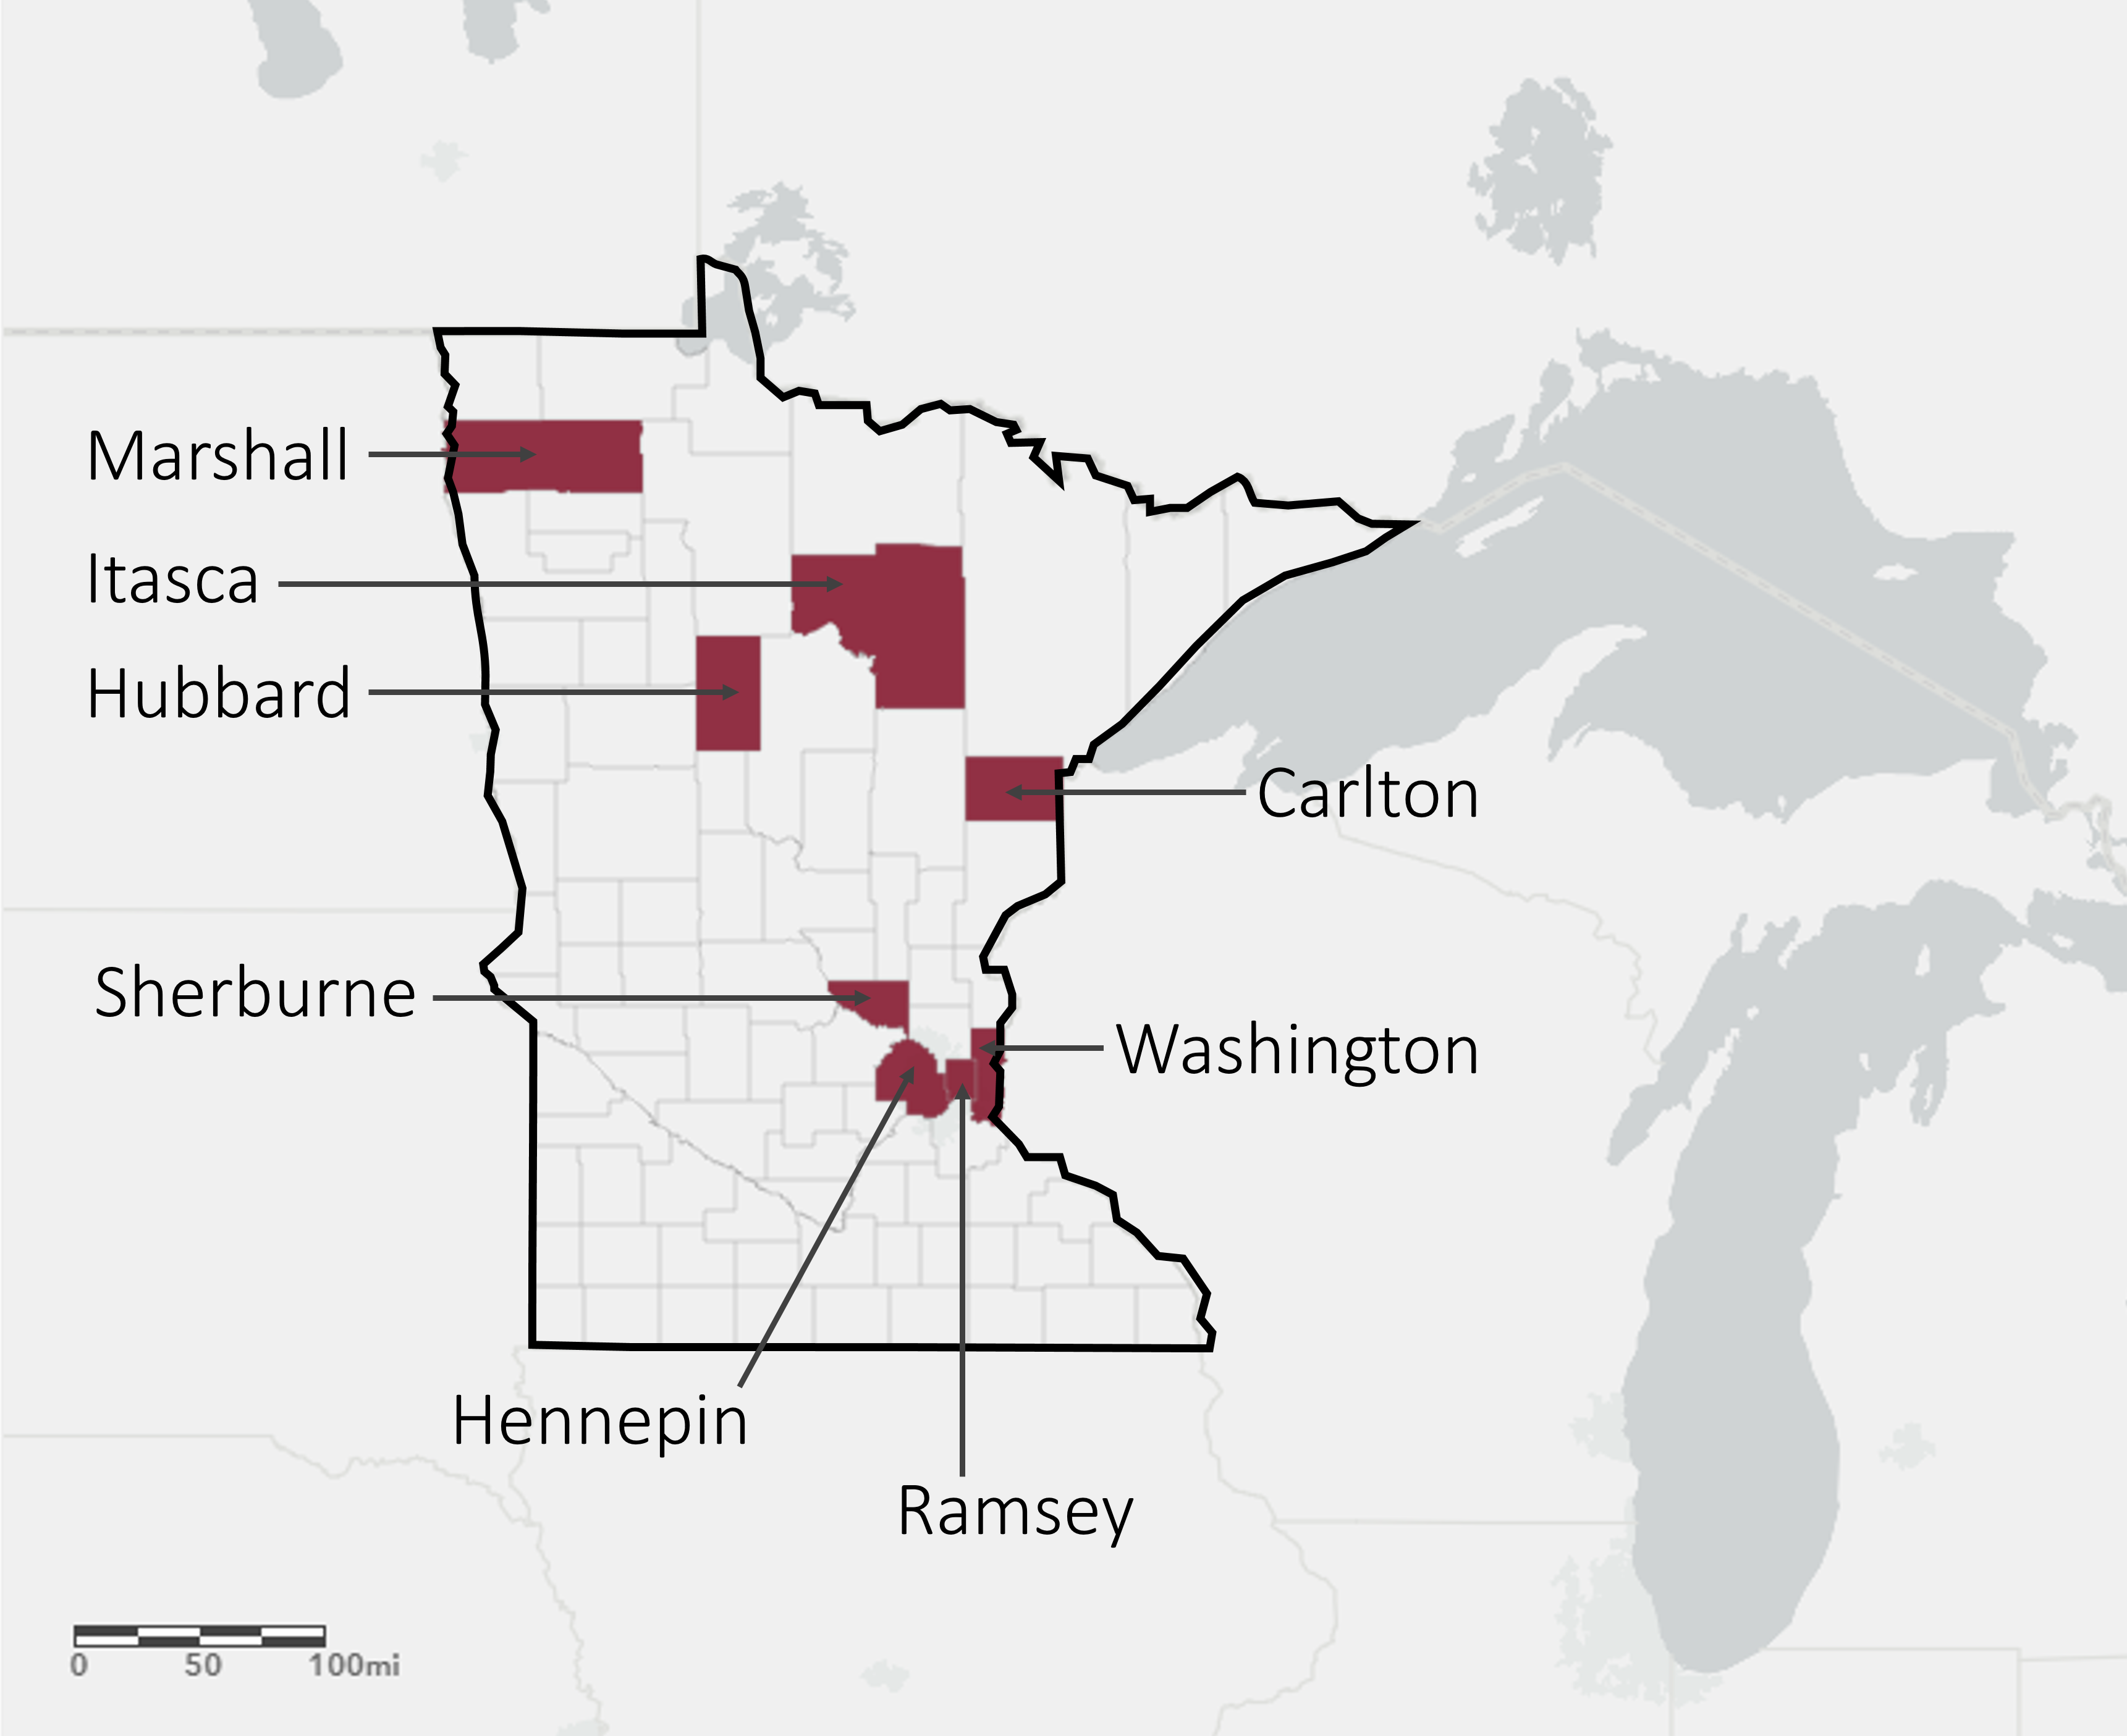
To explore data from these eight counties, start here. What about phenology in other places? Try these tools:
- eBird bar charts: You can customize your charts to show any state, county, or other kinds of regions. Pay special attention to the charts for migratory birds, which will show the most variation over the course of a calendar year.
- USA-NPN's Visualization Tool: Explore a variety of customizable visualizations. The graphs are made with observations from volunteer observers who use Nature's Notebook.
Who collected the data I see on the Season Watch website, and what methods did they use?
All data on this website were donated by regular (but amazing) people who—each in their own way—became deeply interested in their everyday environments. They used simple tools: pencil and paper for keeping a log of phenology notes; sometimes folks used binoculars or cameras to aid in identification of plants and animals. Whether working alone or in small teams, the observers frequently monitored a location where they lived, worked, or volunteered. Frequent observations were essential, allowing them to notice new changes and compare "today" to "yesterday" or "last week".
Each observer developed their own way of organizing their phenology log, because Nature's Notebook did not yet exist. (Nature's Notebook is a continent-wide program that allows everyone to record phenology observations in a standardized, integrated way.) Observation records that exist only on paper are not only difficult to organize, they are also easy to lose or destroy. Therefore, motivated to preserve invaluable information, a team from the University of Minnesota borrowed the observers' paper logs and transferred them to digital spreadsheets. Over 130 of those datasets are available for download on the Season Watch website.
Meet the observers from eight Minnesota counties who donated data to Season Watch:
Carlton County
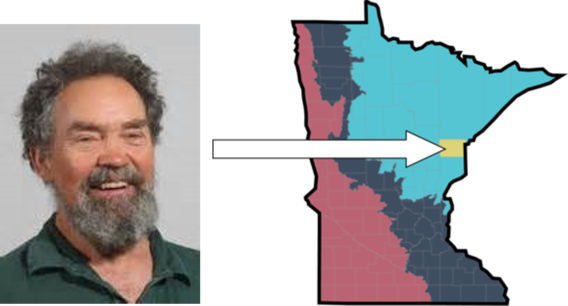
Observer Larry Weber, who takes daily walks and records what he sees in notebooks, says this about himself as a phenologist:
"During the 1970’s, I began keeping a daily nature journal. Here I would record what I observed in the seasonal changes as I went outdoors. My outings were varied, but settled into walking. Moving to the forested former farm (WebWood) where I now live, in the 1980’s, I kept more thorough notes in observance of the nature at home and nearby.
At about this time, I began teaching a middle school science class that was based on the local phenology. We would note the weather; temperature, precipitation, snowfall, etc. but also take a look at the sunrise and sunset and the phases of the moon. But mostly, we followed the changes with the local flora and fauna throughout the school year; weekly walks.
To do this, I needed to learn nature photography. This led to giving talks at teacher meetings, state parks, nature centers and garden clubs. After retiring from the middle school classroom, I taught Minnesota Master Naturalists, Road Scholar and University for Seniors. I wrote a weekly nature (phenology) column for a Duluth newspaper for twenty-five years and did two weekly radio programs for about the same amount of time. I have written more than ten nature books that follow the theme of phenology in the local northland where I live. I still take daily walks and keep a daily nature journal. There’s a new story here every day."
Hennepin County
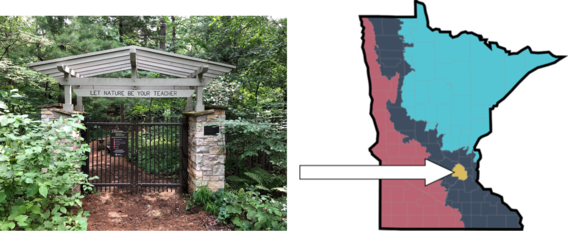
The Eloise Butler Wildflower Garden is located on fifteen acres of wetland, meadow, and woodland, less than three miles from downtown Minneapolis. The site was established in 1907, and in 1929 it was re-named to honor garden curator and botanist-educator Eloise Butler. The Garden has a decades-long tradition of phenology observations and record-keeping, a natural extension of Butler's commitment to collect, protect, and catalogue wild plants of the region.
People who collect data at Eloise Butler Wildflower Garden walk the trails of Garden, typically daily, during the Garden season (April-October) to observe and record information about plants in bloom and wildlife sightings. For over twenty years, field notes have been transcribed into a master list of phenology notes kept in a binder with daily log sheets. Phenology data are currently collected primarily by seasonal naturalist staff at the Eloise Butler Wildflower Garden and Bird Sanctuary. The garden curator and docent volunteers also contribute to the phenology records. Records from before the early 1980s were made primarily by the garden curator and/or head gardener present at the time.
Hubbard County
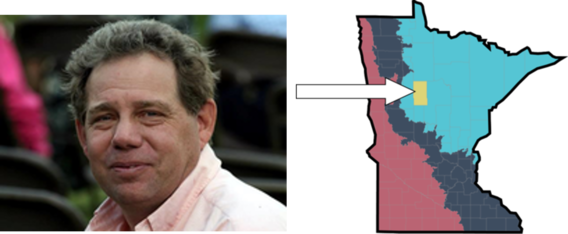
If you ask observer Dallas Hudson how he collects phenology records, he replies "Obsessively,' with his characteristic sense of humor. Dallas has chronicled changes in nature around his home for decades using simple tools like a hand-held voice recorder, a notebook, and a camera.
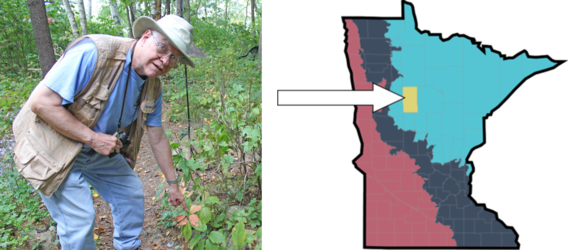
Observer John Weber takes the long view when looking at Minnesota and the organisms that live here. He says, "We are the rookies on the block, and these critters have been here since the ice age retreated 10,000 years ago. We want to blend in yet also record what we are seeing." And indeed, John does exactly that, describing his process this way: "With my digital voice recorder, I can walk and talk, documenting what I see while taking photos and using my binoculars." He then transcribes his notes onto paper. Observing phenology is John's passion, and his motivation is to raise climate change awareness. Read
more >
Photo of John by Robin Fish / Park Rapids Enterprise. Interview excerpts courtesy Lorie Skarpness, Park Rapids Enterprise
Itasca County
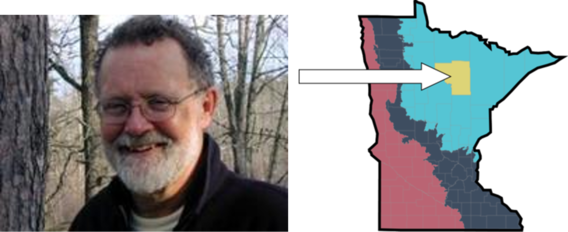
Observer John Latimer keeps notebooks where he writes down changes in nature. In addition to taking frequent nature walks, he keeps his eyes, ears, and memory alert for changes in nature, no matter what activity he's doing.
Marshall County
Ramsey County
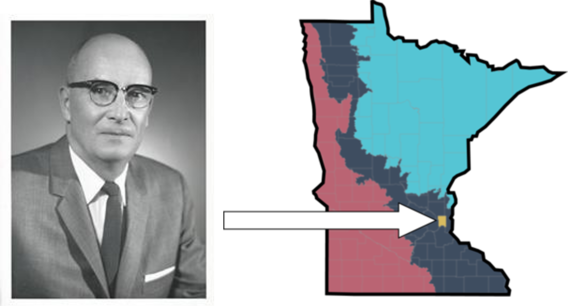
What are the trees doing as you pass by them on your everyday walk to and from work? Professor Alec Hodson became interested in this question while making his way to his entomology lab and classroom, located on the University of Minnesota's St. Paul Campus. Professor Hodson opened a field notebook, wrote down what he saw, and kept doing this for fifty-one years. Dr. Hodson's records on the timing of fourteen phenophases of woody plant species on and near campus were later scanned, digitized, and published in the University of Minnesota Digital Conservancy.
About Dr. Hodson:
Dr. Hodson was born in Reading, Massachusetts and attended the University of Massachusetts (B.S. 1928), and then the University of Minnesota (M.A. 1931 and Ph.D. 1935). During his graduate student period, he also attended the University of Washington’s Puget Sound Biological Station in the summer of 1930 where he studied marine ecology, an experience which was to have a profound influence upon his later career. He studied and worked as a Teaching Assistant, and later as an Instructor, while a graduate student in the Departments of Zoology, and Entomology and Economic Zoology. Through his career in the latter Department, he moved up through academic ranks to Professor and finally to Head of the Department in 1960. In 1962, he was instrumental in changing the Department’s name to Entomology, Fisheries, and Wildlife. In 1974, at the age of 68, he retired. Dr. Hodson passed away March 13, 1996 at the age of 89.
Source: University of Minnesota, Department of Entomology Newsletter, 2008, page 9
Sherburne County
Information about the observers at Sherburne National Wildlife Refuge is coming soon.
